Tips for Using the Landing Distance Analysis
The Flight Data Viewer’s Landing Distance Analysis will help you determine your aircraft's landing distance. It works just like the 'Take Off Distance' analysis tool.
This tool requires an EFIS that records: GPS data and VSI (vertical speed
changes).
Test procedure
As the test pilot it is your responsibility to create a landing distance testing plan. There isn't one prescriptive list of procedures or what to do (or not do).
For all landing tests: perform a normal landing, with a stabilized approach, especially below 50 feet AGL. Stop on the runway surface for at least 2 seconds. (Required! This is the point where the landing's full stop point is measured. The stop cannot be on a connecting taxiway.)
When designing your landing distance test flight program take the following into
account. Landing distance is affected by: RPM, flap position, density altitude
(mostly determined by outside air temperature), wind, aircraft weight, runway surface type and the type of landing – three point or wheel landing.
To reduce measurement errors caused by the equipment attached to your EFIS perform
at least three landings for each configuration. That means three landings with the same RPM, flap setting, outside air temperature, winds, weight, same runway
(and direction), and using the same landing technique. This methodology will allow you to create a matrix of data corresponding to common landing conditions for your aircraft.
Remember to make a note of the aircraft weight and the wind conditions during your testing. If you forget to note the aircraft weight it can be estimated by using the remaining fuel quanity recorded by your EFIS. (Assuming the fuel level probe is accurate.)
Post Flight Analysis:
- After the flight extract the data from your SD card using standard procedures.
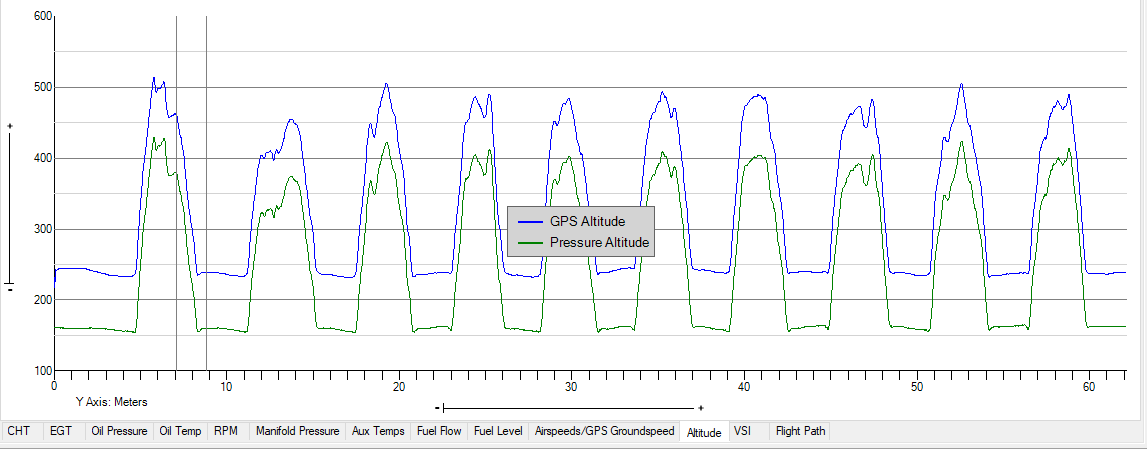
- Click on either the Altitude, Airspeeds, VSI, or Flight Path tab. Usually the Altitude tab is the best choice.
- Select a range that includes one landing. Click on a point where the aircraft is at least 50 feet AGL. Refer to Figure A.
- Click on the graph just before the 50 foot AGL point,
- Hold down the ‘SHIFT’ key,
- Click on the graph just after the ground speed reaches 0.
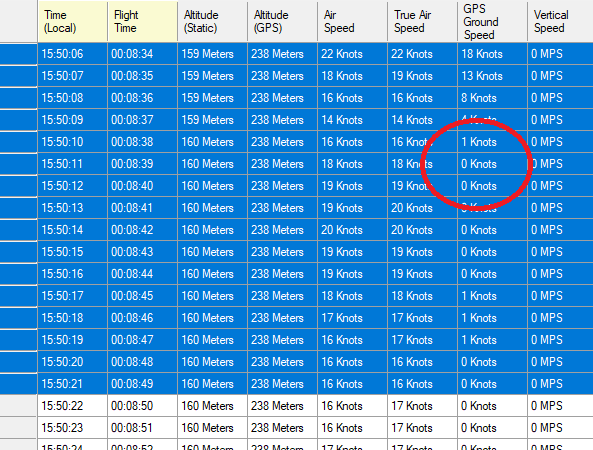
- Verify that the range includes at least one sample where the GPS ground speed is zero. Do that by scrolling down in the data grid table to the point where you see at least one zero GPS ground speed value. Refer to Figure B.
- Optional, but recommmeded. Name (and save) this selected range of data. Press the < F2 > key. This will allow you to easily find and select this range in the future. See for complete range selection instructions.
| Figure A |
 |
| Figure B |
 |
- Make sure the Altitude, Airspeeds, VSI, or Flight Path tab tab is still visible.
- From the menu select ‘Analyze’ --> ‘Landing Performance’ --> ‘Calculate and Save Landing Performance for Current Range’
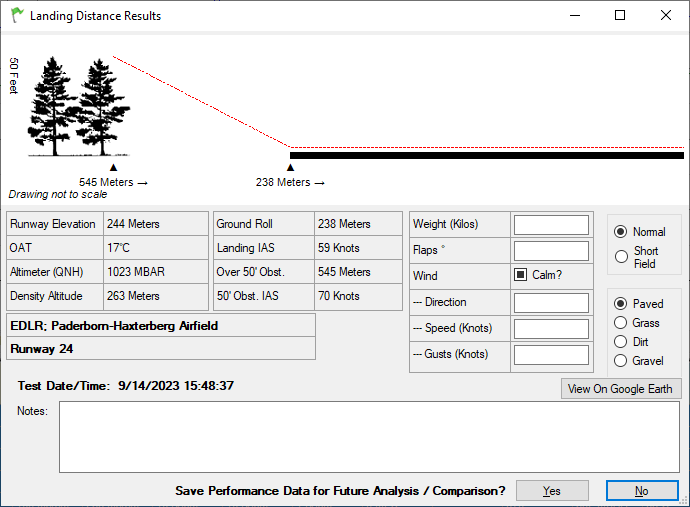
- The analysis will run and the results will be displayed. See Figure C. (Note this analysis may take up to 30 seconds. It needs to scan a large database of airports and runways.)
- If desired fill in: aircraft weight, flap setting, winds, type of landing, and runway surface.
- Add any notes that you wish to save with this landing distance analysis. These notes will appear on printed reports.
- If desired you can see the flight path on Google Earth. The displayed path will only include that portion of the flight from 50 feet AGL to the full stop on the runway.
- Click 'Yes' to save this data for inclusion in your landing distance data library.
| Figure C |
 |
Viewing the Library of Saved Landing Distances
- From the menu select ‘Analyze’ --> ‘Landing Performance’ --> ‘View / Analyze Landing Performance Data’
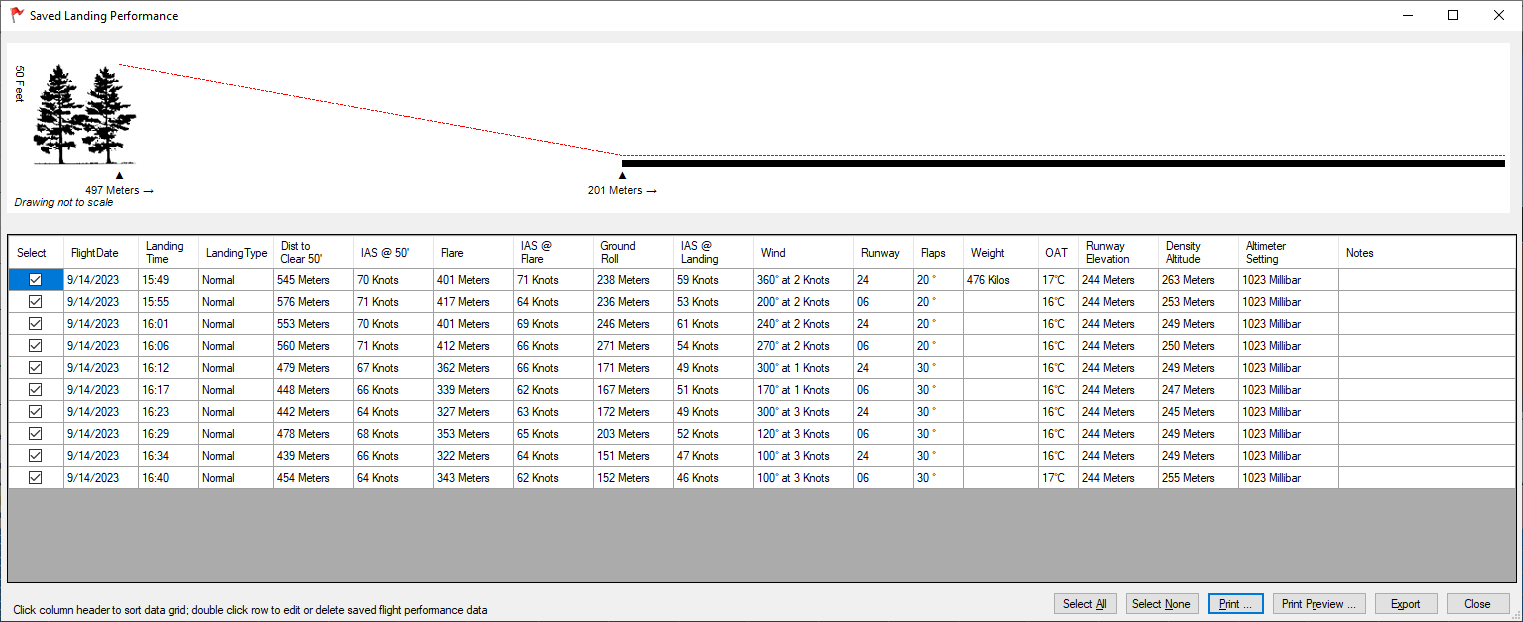
- The list of previously saved landings will be displayed. See Figure D.
- Select or unselect a row of data by clicking on a checkbox at the beginning of each row. Only selected rows are included in the printed reports.
- Double click a row to edit or delete the landing data.
- Sort the data by clicking on a column header. Clicking on the same column header again will sort the data in reverse order. This selected order will be used in printed reports.
- Click the 'Print Preview' or 'Print' buttons to create a printed report. See Interpreting Landing Distance Data below.
- Click the 'Export' button to create a CSV file which can be opened in Microsoft Excel or other spreadsheet application.
| Figure D |
 |
Interpreting Landing Distance Data
Sample landing distance report (PDF format)
The distance to a full stop from 50 feet AGL (and it's associated IAS) is
very accurate.
The distance to a full stop from the flare point (and it's associated IAS) is also
very accurate.
The distance to a full stop from the start of the ground roll (and it's associated IAS) is
not as accurate as the two previous data points. This is due to the fact that there is no definitive change in any of the recorded data that positively marks the start of the ground roll.
It will be up the the test pilot to use their own judgement to determine how this data will be used in their aircraft's POH.