Tips for Analyzing Climb Rate (Vx / Vy)
The Flight Data Viewer contains an analysis tool that can help you to determine the best rate and angle of climb (Vx / Vy) for your aircraft. The tool itself is fairly easy to use however you must carefully plan your flight tests to attain the best results.
Estimate your plane’s Vx / Vy – Using information obtained from your kit manufacturer, other pilots, or your own experience estimate what your Vx / Vy will be.
For our example aircraft we will estimate that Vx / Vy are in the low 70 MPH range.
Determine flight test indicated airspeeds – To calculate Vx / Vy you must make test climbs using at least four (4) indicated airspeeds. Include airspeeds below and above your plane’s estimated Vx / Vy airspeeds. Always keep in mind your aircraft’s operating limitations,
especially the stall speed.
For our example aircraft we will climb at the following airspeeds:
60, 65, 70, 75, 80, 85 MPH
Determine climb profile – To run the analysis tool you will need to select each separate climb segment using the Flight Data Viewer. This step will be easier if you plan for and use a consistent climb profile.
An example climb profile –
Start at 1,800 MSL
Begin climb at the target indicated airspeed
Try to consistently maintain the airspeed
Climb to 3,000 MSL
Select an altitude gain that will require at least 60 seconds of climb.
Determine indicated airspeed order – You do not need to perform the climbs in any particular order, or necessarily during the same flight. (However, attempt to choose days where the density altitude, temperature, etc. are similar.) Choose an order that will be
the most comfortable and easy for you to fly. Most pilots will find it easier to maintain a constant airspeed
while climbing at higher airspeeds.
So for our example we will perform the climb tests in reverse order, starting at 85 MPH and working down to 60 MPH.
Note the order on your kneepad.
-- FLY USING THE FLIGHT PLAN --
The Flight Data Viewer's Vx / Vy Analysis Tool
After your test flight(s) load the data into the Flight Data Viewer.
For each of your preselected indicated airspeeds select the range of data. (See
for complete range selection instructions.) If you used the climb profile suggested above you will:
- view the altitude graph
- select the start of the range where the altitude is 2,000 feet
- select the end of the range where the altitude is 3,000 feet
- optionally, save the range (use the target indicated airspeed as the range name)
- from the menu select ‘Analyze’, ‘Climb Rate’, ‘Calculate & Save Climb Rate for Current Range’. You will see a form similar to this.
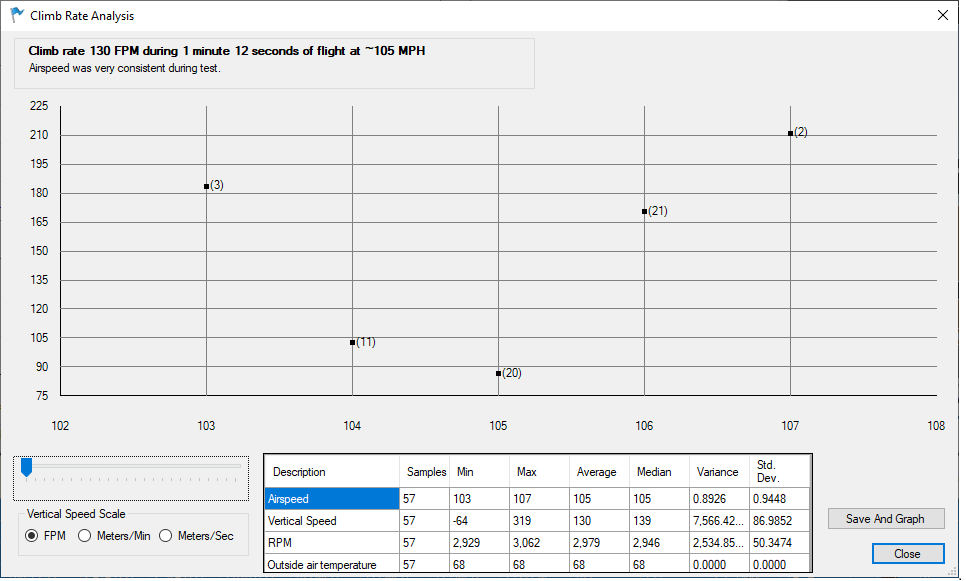
The data in this form tells you how consistent you were at maintaining the target indicated airspeed during the climb. You will see one of these messages above the scatter graph:
Airspeed was very consistent during test.
Airspeed varied somewhat during test. Consider rerunning flight test.
Airspeed varied considerably during test. Consider rerunning flight test.
Ideally you’ll see the first message. If you see the second message you can use the data, but you may want to fly that climb test again. If you see the last message do not save that data.
The scatter graph shows indicated airspeed on the X axis and climb rate on the Y axis. The values in the body of the graph show the number of seconds you flew at
a given airspeed. In this example the pilot flew for 20 seconds at 105 MPH, 21 seconds at 106 MPH, and 11 seconds at 104 MPH. A spread this narrow is what you are trying to achieve.
Click the “Save and Graph” button.
Repeat these steps for each target climb airspeed.
View the Vx / Vy graph
From the menu select ‘Analyze’, ‘Climb Rate’, ‘View Vx / Vy Graph’. You will see a form similar to this.
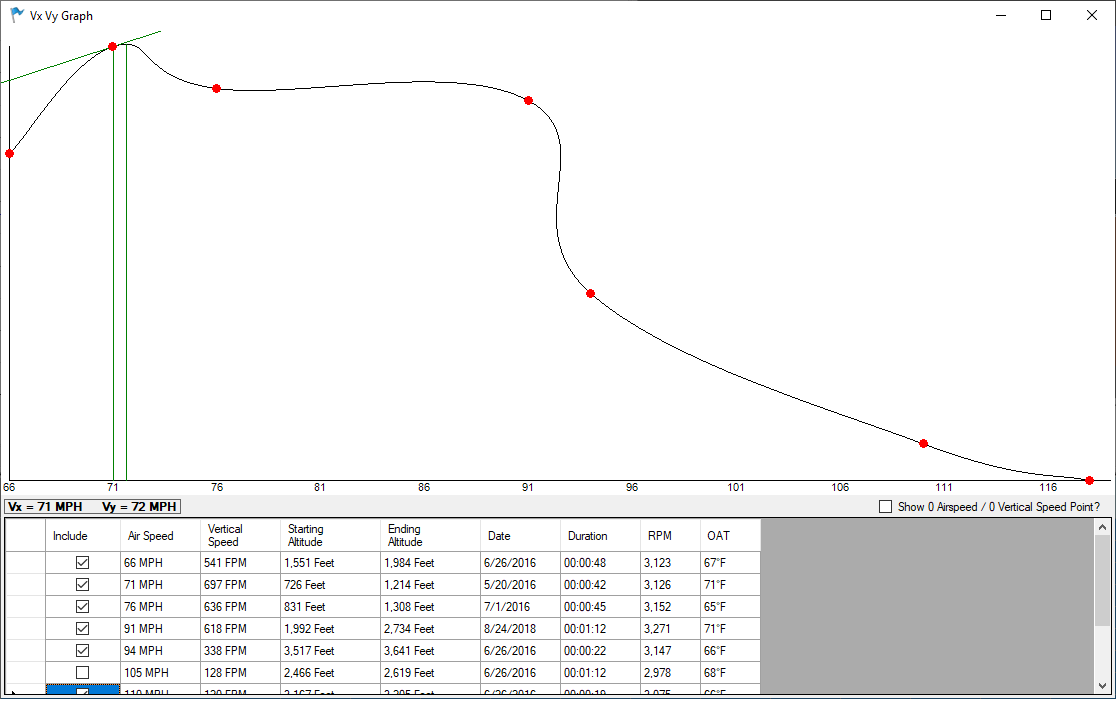
Uncheck the ‘Include’ box to see how excluding a saved climb affects the Vx / Vy calculation.